Impact-Effort Matrix
A 2x2 that plots initiatives by value against effort, so you see what to start now, plan for, or kill.
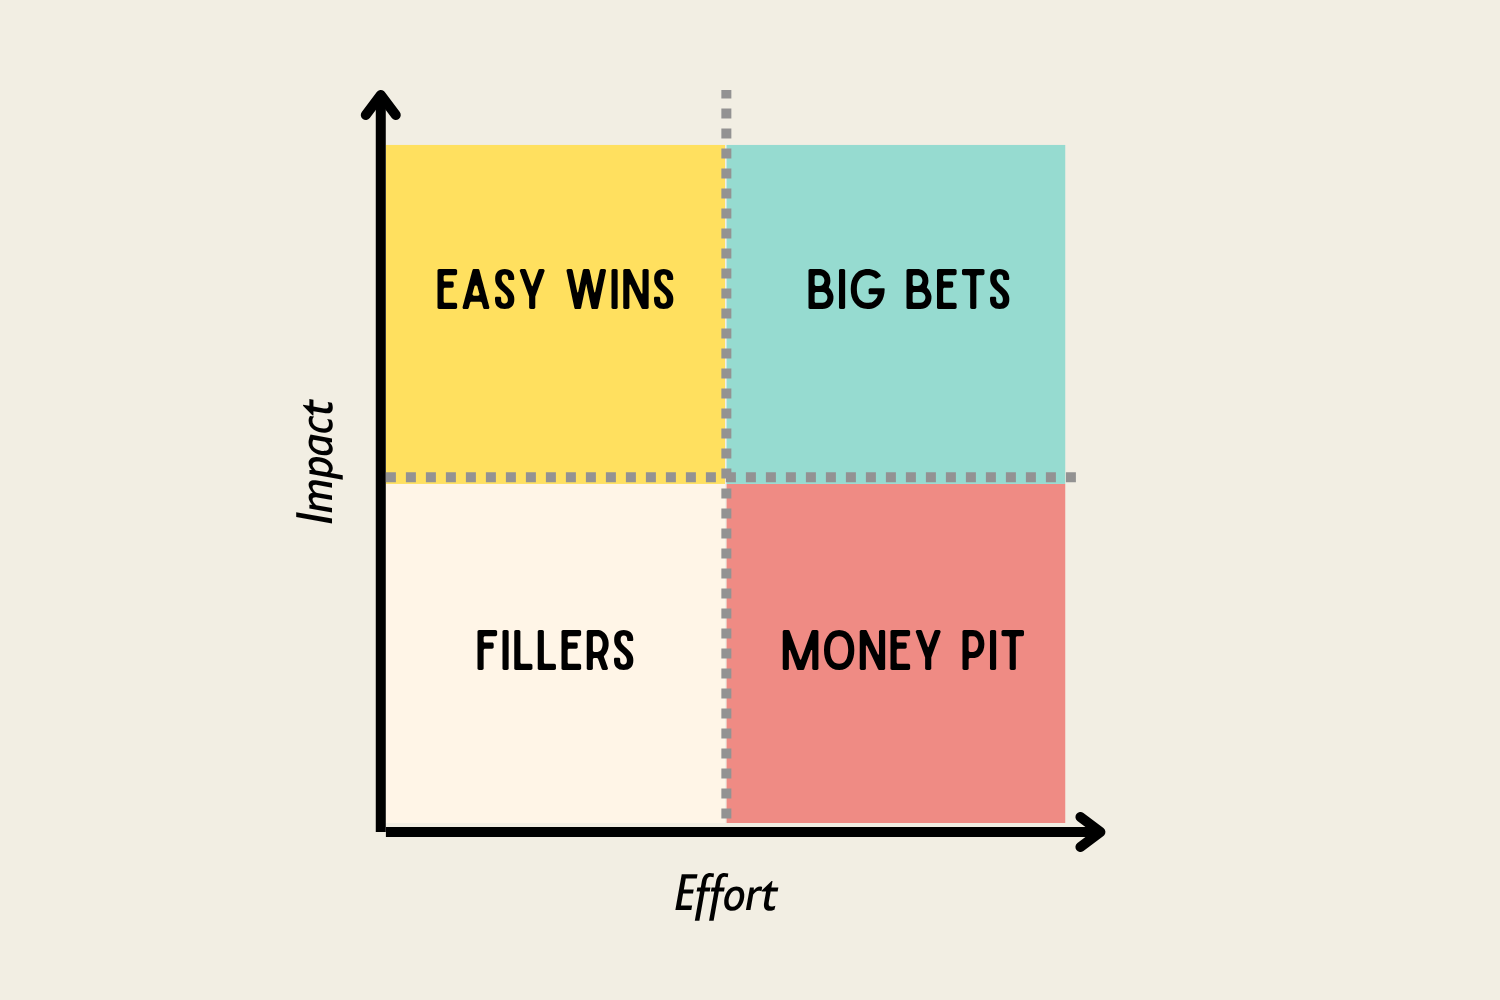 Find this on the mind-map
Introduction
The Impact-Effort Matrix has been floating around product management, process improvement, and lean practice for a long time — a fast way to compare competing initiatives without building a formal scoring model for every decision. Gaurav Jain includes it in The Leader's Playbook as one of the core prioritization tools every manager should have on hand, precisely because it doesn't require a spreadsheet to use.
How It Works
You're plotting every initiative on two axes:
- Impact — the value it creates, in business terms, customer terms, or both.
- Effort — what it takes to deliver: time, headcount, technical complexity, how many other teams you need to drag along.
Plot enough initiatives and you get four quadrants:
| Low effort | High effort | |
|---|---|---|
| High impact | Easy Wins (or Quick Wins). Big results for little work. Start these now. | Big Bets (or Major Projects). Real time and resources, but a large payoff. Plan for these deliberately. |
| Low impact | Fillers (or Fill-ins). Easy but marginal. Only worth doing if you've got slack. | Money Pits (or Time Sinks). Drain resources, return little. Stop, delay, or rethink. |
Notice you're not measuring anything precisely here — you're comparing. You stack-rank initiatives against each other rather than scoring each one in isolation, which is exactly why rough judgment works better than fake precision. The matrix isn't making the decision for you. It's a lens that forces two questions onto every item on your list: how much value does this actually create, and how much is it going to cost you to get there.
If you know the Eisenhower Matrix, think of it this way: that one sorts your personal calendar by urgency. This one sorts your team's whole portfolio of initiatives by return on effort.
Why It Matters for Leaders
Most teams aren't short on ideas. They're short on clarity about which ideas actually deserve their next quarter.
That pressure is real and it's everywhere — a Gallup survey found 64% of managers feel overloaded by sheer task volume, and in that state, everything sounds urgent, because everyone on your team has an opinion about what's urgent. Bad prioritization has a real cost too: wasted time, burnout, missed goals. A Harvard Business Review study found teams using structured prioritization tools like this one saw a 20% boost in productivity.
Once you actually plot the work, patterns jump out fast: easy wins you'd been sitting on without realizing it, big bets that genuinely deserve real investment, and the money pits quietly eating your team's energy every week. Money pits are the hardest quadrant to kill, usually because someone senior sponsored them — but putting them on a shared picture makes them much easier to stop than arguing about them one at a time in a meeting.
Picture this: you're weighing a small feature that takes a few days and visibly lifts customer satisfaction — that's an Easy Win. Next to it sits a backend rebuild that takes months but transforms reliability — that's a Big Bet. Both matter, and seeing them side by side means you don't have to pick one. Put junior engineers on the feature while your senior engineers scope the rebuild, and you're running both in parallel instead of treating them like they're competing for the same slot.
What to do next
Test your knowledge of Impact-Effort Matrix
Practice Impact-Effort Matrix
Apply Impact-Effort Matrix to a real situation
Skills related to Impact-Effort Matrix

Frameworks related to Impact-Effort Matrix
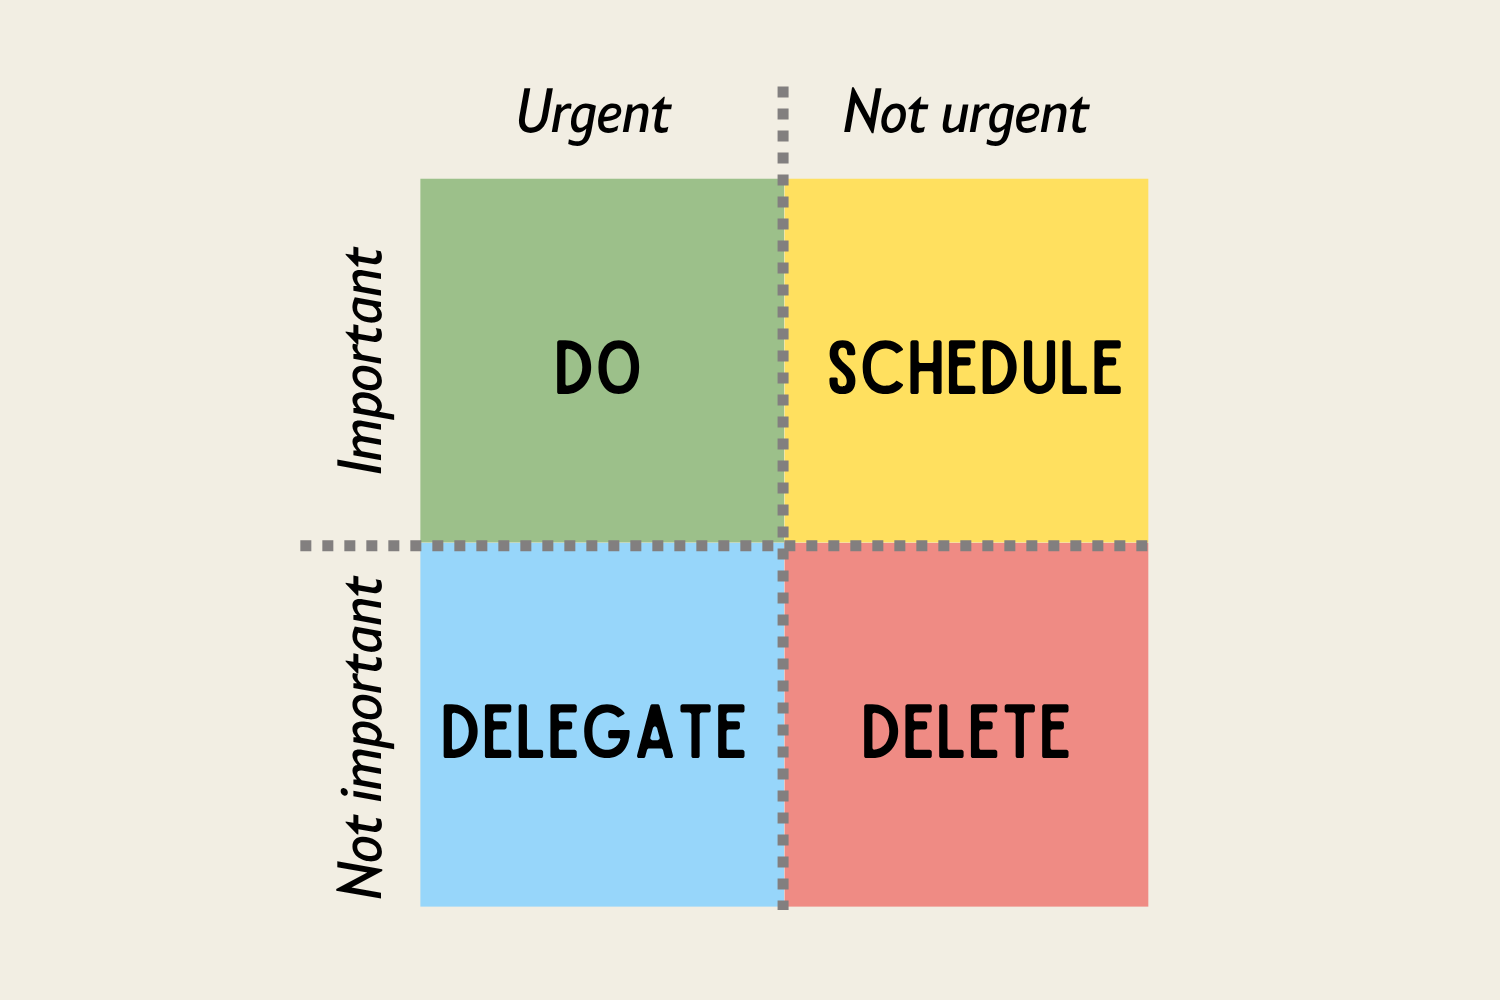
Eisenhower Matrix
A simple 2x2 that sorts tasks by urgency and importance, so what actually matters gets scheduled instead of whatever's loudest.

MoSCoW Method
A prioritization method sorting your plate into four buckets — Must have, Should have, Could have, Won't have — forcing trade-offs early.
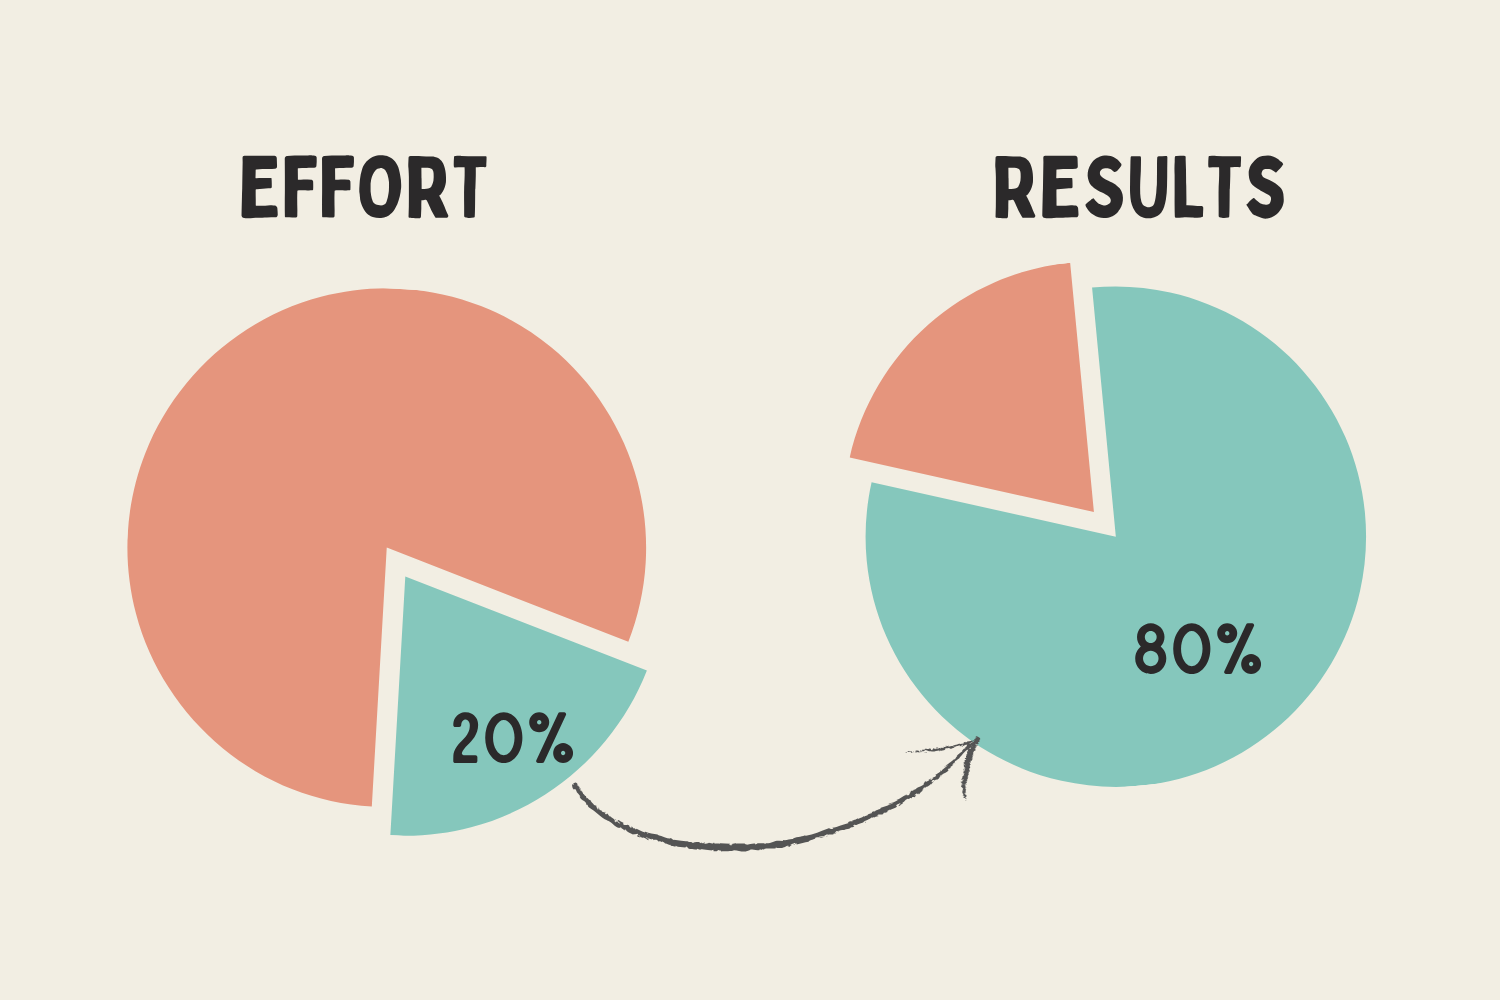
Pareto Principle
Roughly 80% of outcomes come from 20% of causes — find the vital few projects, people, and bottlenecks driving results.
Books related to Impact-Effort Matrix

Essentialism
Greg McKeown's argument that "doing less, but better" isn't a time-management trick. It's a different operating system for deciding what deserves your effort at all, built on one uncomfortable premise: almost everything is non-essential.

The One Thing
Gary Keller and Jay Papasan's case that most to-do lists are really long lists of ways to avoid asking the one question that matters. Success usually comes from sequencing, not from doing more things at once.